1
Capture
Bad example
Missing primary CTA above the fold
LandingQA audits what visitors see and shows where clarity, trust, mobile experience, performance, or the CTA may be costing leads, signups, or sales. You receive prioritized, evidence-backed fixes to test.
Page friction Evidence Testable fix
One conversion blocker. Five clear steps. A corrected page you can test.
Missing primary CTA above the fold
Measured evidence from the controlled page
The primary CTA appears 77 px below the 844 px mobile viewport.
Below the 44 px minimum tap-target height used by the audit.
Minimum 44 px recommendedMove the primary CTA above the fold and increase the tap-target size.
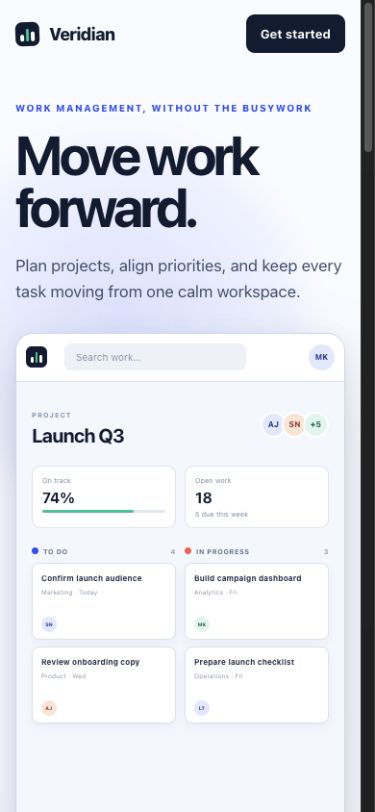
Corrected page preview
Get started
Audit evidence, not predicted conversion uplift.
LandingQA checks the places where a page can lose clarity, trust, momentum, or action. Every finding lands in one pillar, then rolls into Conversion Readiness, Technical Health, and SEO Health so you know what to fix first.
DECISIONS YOU CAN TRUST
Every finding keeps its source, evidence, confidence, and next step.
Dimensions, contrast, links, metadata, performance, and accessibility.
Clarity, persuasion, trust, visual hierarchy, and journey findings.
Aggregate observations stay separate from page measurements.
Use the findings to decide what to inspect and test with visitors.
Every label stays attached to its evidence in the saved report.
EXAMPLE REPORT
This representative report for a fictional page shows how potential conversion blockers connect to captured evidence, prioritized fixes, and validation plans. The full example includes every score and finding.
Start with a public URL. See the finding totals before you decide whether to pay.
Start the scan before paying. When the report is ready, you see the finding totals and decide whether to unlock the evidence, fixes, and validation plan.
Start with any public SaaS or service landing page.
Open the private link on this device or another one.
The scan continues on our server and we email you when it is ready.
Payment is requested only after the summary is ready.
See the summary now. Unlock the evidence when you are ready.
Claims, evidence, scores, corrections, and validation plans stay locked until you use one report credit.
WHY LANDINGQA
A chat can suggest ideas. LandingQA gives every finding the evidence and next step needed to check the work.
Every measured check is language-agnostic and runs on any page. These checks include contrast, tap targets, metadata, links, Lighthouse, and axe-core. Interpretive findings are multilingual, and each carries its own confidence score. Pages behind a login, paywall, or bot wall cannot be captured, and forms are never submitted.
Corrections are previewed in an isolated sandbox and rescanned there. Nothing is written back to your site, and the browser cannot purchase, register, submit, or mutate anything.
The scan and a one-finding preview run first. Exact price and terms appear before purchase.
The findings are listed above with their measured values. We publish nothing about our own conversion rate because a number from our business would not predict yours. We will still submit to the audit we sell. Scan this page and check the work yourself.
Start with the URL. Confirm your email, follow the scan, and decide whether to unlock the complete report when it is ready.